Market Pulse: Fed Meeting Madness
In 8 minutes, let’s discuss expectations leading into the FOMC, what the Fed signaled to the market and why, and where we’re likely headed from here.
In 8 minutes, let’s review the outcome of last week’s FOMC meeting and where the markets are likely headed from here.
At a high level, this FOMC meeting can be summarized as being incredibly bullish.
The Fed met market expectations on the number of rate cuts that will happen this year, which is 3 starting in June. This was welcome news given that, in the previous FOMC meeting in January, the Fed shot down the market’s highly optimistic assumption of 5 rate cuts and forced the market to significantly pare back its rate cut expectations.
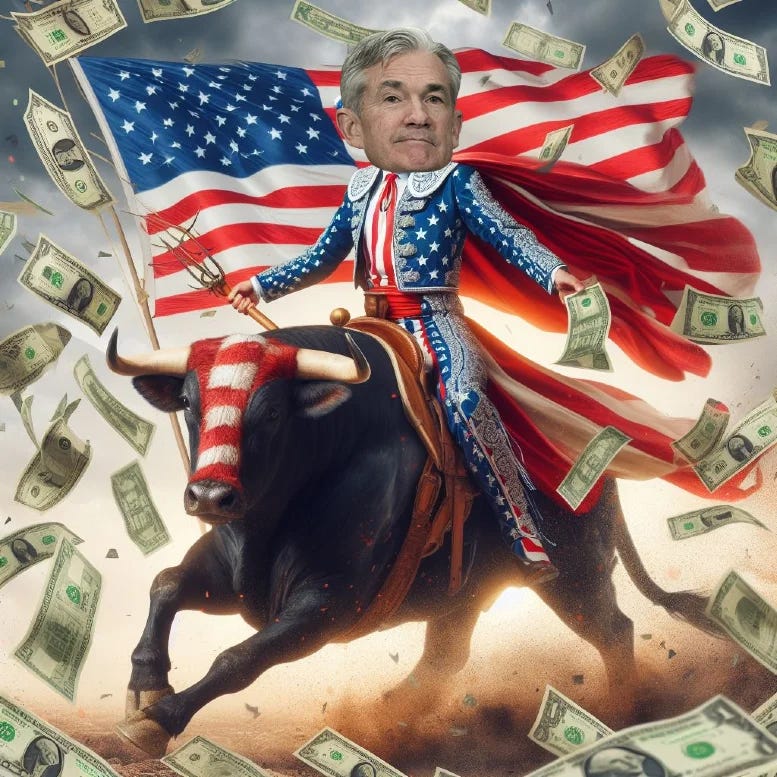
In addition to matching the market’s expectations for rate cuts this year, Fed Chair Jerome Powell went above and beyond to signal an impending loosening of monetary policy.
This extra dovishness was very well received by markets but also largely unexpected.
The inflation data from the past two months have been stubbornly hot, the stock market has been soaring since November (up almost 30%!), there’s significant liquidity in lending markets with corporate credit spreads being very tight, and the economy is growing nicely.
Yet in such a high inflation and high growth environment, Powell’s continued pushing on the monetary policy gas pedal is quite surprising.
A few key points from the FOMC press conference:
Despite January and February’s hot inflation data, Powell thinks that the disinflation story hasn’t changed and inflation is “moving down gradually on a sometimes-bumpy road toward two percent”.
On January inflation, Powell said, “but so I would say the January number, which was very high, the January CPI and PCE numbers were quite high”
On February inflation, Powell said, “The February number was high, higher than expectations”
Powell called the current monetary policy “restrictive” yet the stock market has been soaring since November, with the S&P 500 rising by almost 30% and the economy growing nicely as well.
Powell crowned all this dovishness with a golden cherry on top by signaling an impending tapering of the Fed’s ongoing Quantitative Tightening (QT) operations (balance sheet shrinking).
For QT, the Fed is currently allowing $60 billion of Treasury securities and $35 billion of mortgage-backed securities to run off its balance sheet each month.
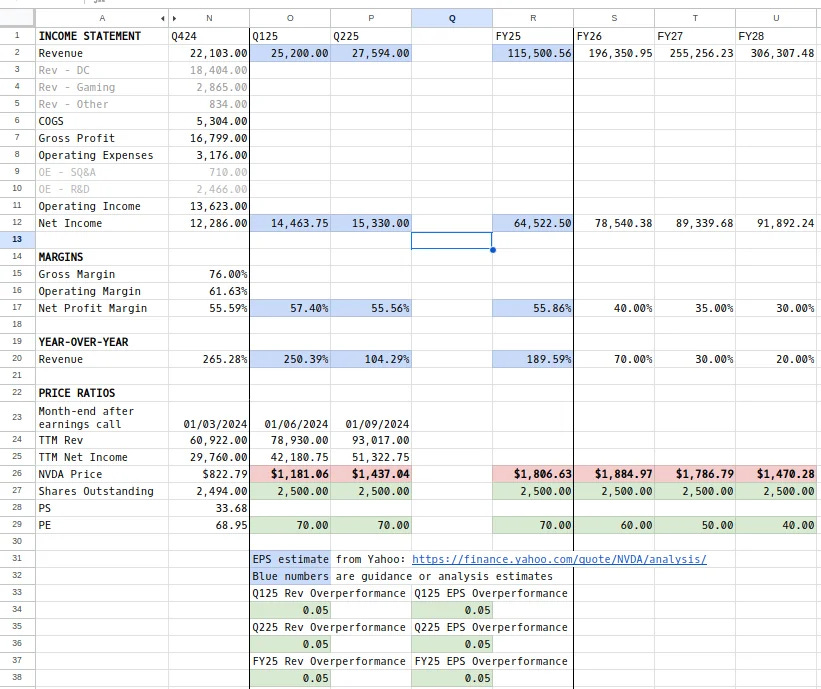
📊 NVDA and AMD financial models
A small interruption to share two financial models that we worked on, one for NVDA and one for AMD. Feel free to clone them and play around with the numbers.
You can find the models here:
Why So Dovish?
As mentioned above, the Fed’s extra dovishness was unexpected. All economic numbers point to at least some cautionary messaging.
We think that there are several reasons that could compel the Fed to unnecessarily add fuel to an already blazing fire.
Populist Election Year
First, this is an election year, and it’s not just any other election year, it’s a populist election year.
As well-known fund manager Cem Karsan has been astutely pointing out, the US government is a lot more fiscally and monetarily undisciplined during populist election years which leads to large stock market gains for those years.
Don’t believe this idea? Just take a look at how the US stock market has performed in historical populist election years in the past century. Cem Karsan shared these stats:
There were 24 election years in the past century from 1928 to 2020.
The average return for those years is 11.5%, about 3% higher than the stock market’s overall average performance.
The election year gains are highly concentrated in just a few years. Karsan points out that the average return of the stock market in the 5 elections years, 1964 (Lyndon B. Johnson), 1968 (Richard Nixon), 1972 (Richard Nixon), 1976 (Jimmy Carter), and 1980 (Ronald Reagan), was a whopping 21%! These elections all happened during the last major period of high inflation and high populism.
Well, the US is again steeped in an election year with high inflation and high populism and given the above idea, it’s not out-of-the-norm for the Fed to loosen monetary policy more than necessary.
The World Is In A Perilous Spot
A second major reason for the Fed’s dovishness is that, behind closed doors, it’s likely scared of an impending economic downturn.
This is not an unreasonable position to have given the world’s present circumstances:
$160B of liquidity has to go now that the Fed’s BTFP has expired
The Fed created the Bank Term Funding Program (BTFP) last year as an emergency measure to stave off a cascading insolvency crisis among regional banks.
The BTFP has so far supplied $160B of liquidity to the economy and it just expired earlier this month.
BTFP loans have a duration of one year so all outstanding loans will have to be paid back by March of next year. That’s $160B of liquidity receding from the economy within a year.
US liquidity has already significantly pulled back in the last two weeks
I’ve cited Lyn Alden’s US liquidity equation a few times in previous issues. Needless to say, I quite like it as a unique view into US liquidity that you won’t find in traditional finance media outlets.
According to this equation, US liquidity has already started significantly receding in the past two weeks.
While the equation showed liquidity steadily rising since the start of the year to $661B, it has fallen sharply to just $4B last week!
The Bank of Japan is done printing money
The Bank of Japan (BoJ) has been the most aggressive money-printer among central banks in the past decade and a half.
The BoJ is the only G20 central bank that has been buying the country’s corporate equity and debt, while keeping its policy interest rate below 0% for almost a decade, and also instituting a highly aggressive yield curve control policy to pin down long-term interest rates.
No other central bank comes even remotely close to the BoJ’s massive scale of asset purchases and interest rate control measures.
In doing so, the BoJ now owns 40% of Japan’s national debt and is also the largest holder of Japanese stocks.
Japan’s large role in the global economy means that when the BoJ prints money, it indirectly stimulates other national economies as well. Not surprisingly, the US is the biggest beneficiary of the BoJ’s money-printing.
The problem is, the BoJ has just embarked on a seismic shift in its monetary policy and will stop printing money at the scale it has in the past decade.
Last week, the BoJ ended eight years of negative interest rates and raised its policy interest back into positive territory.
In addition, it also pledged to slowly reduce its purchases of commercial paper and corporate bonds, with the aim of stopping this practice in about a year.
It’s also abandoning its yield curve control policy.
Russia’s gasoline export ban threatens higher inflation
In the last week of February, Russia announced a surprise ban of all gasoline exports starting on March 1st and lasting for 6 months.
This is a significant hit to global energy supply because, despite all the Western sanctions on Russian energy, much of the world has been wantonly indulging in cheap Russian energy, whether overtly or clandestinely.
The free flow of Russian energy throughout the world has kept a lid on energy prices and more importantly, a lid on global inflation.
The US may outwardly denounce the use of Russian energy but because turning a blind eye is anti-inflationary, it secretly wants more Russian energy to flood global energy markets.
Perhaps this is why the US recently and surprisingly denounced Ukraine’s escalating attacks on Russia’s energy infrastructure.
The abrupt cessation of Russian gasoline exports threatens to reignite global inflation. Not good!
Global conflict is escalating
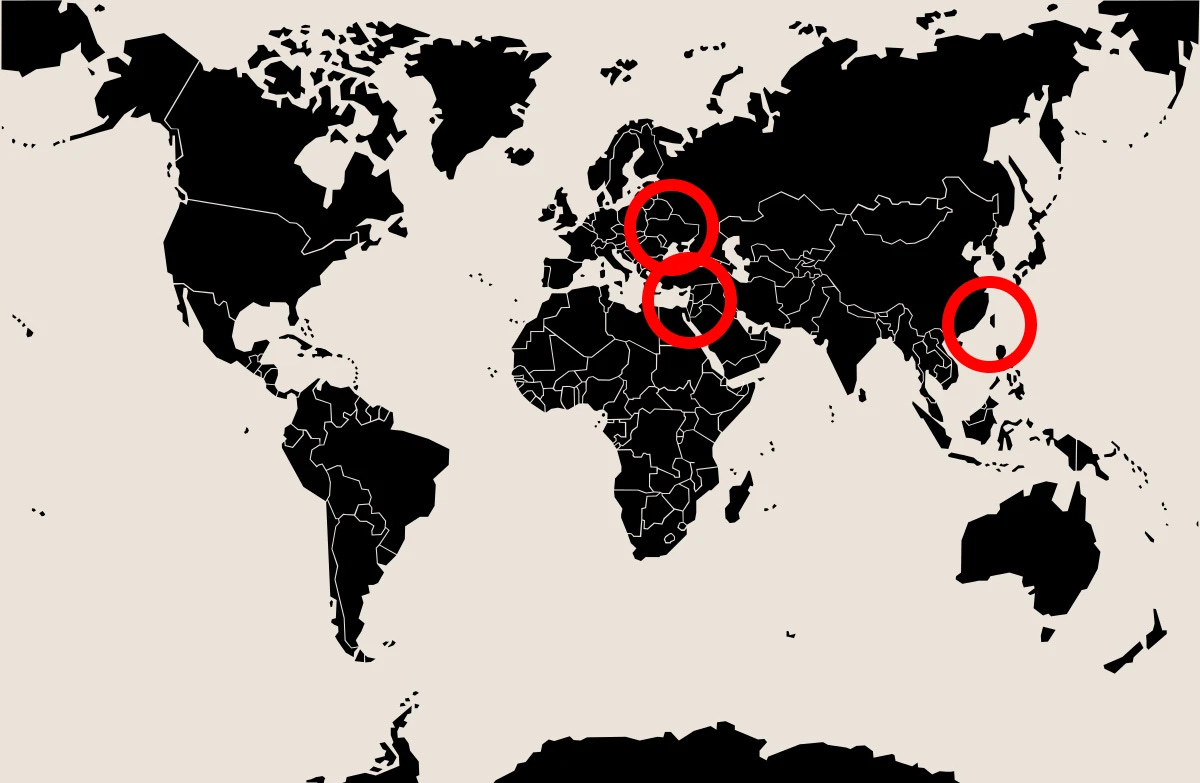
Worldwide conflict is escalating. The war in Eastern Europe is massively turning in Russia’s favor. Israel is about to embark on a perilous operation that will draw the majority of the world’s ire. China is chomping at the bit for invasion and reunification.
Needless to say, conflict hurts global finance and the Fed is probably well aware of the tenuous global situation.


