Research - Predict the Market With the Dark Index and Gamma Exposure
Predict short-term market movements with the two powerful market indicators, the Dark Index (DIX) and Gamma Exposure (GEX). Simply but deeply explained.
In this article I attempt to simply but deeply explain the Dark Index (DIX) and Gamma Exposure (GEX), two powerful market indicators that can be used to forecast short-term market movements. In addition, understanding how they work sheds light on the inner workings of parts of today’s vast and complex stock market.
Market Makers
Before I jump into the DIX and GEX, we need to first understand market makers. Market makers (MMs) are market participants that get paid to add liquidity to markets. That is to say, every time an investor wants to buy or sell a stock on the market, there is someone they can buy or sell to, and the price is a good price.
As such, MMs are found on both sides of the market, creating bids and offers. A good MM will keep the distance (the spread) between the bid and offer minimal. A wide spread results in non-optimal prices for traders. It’s not great to sell into a low bid, or buy into a high offer.
MMs are operated by major financial firms like Citadel and dominate the stock market. It’s incredibly lucrative to operate one… if you’re fast and cutting edge. The omnipresence of MMs means that they can move markets, at least in the short-term, and it’s thus very beneficial for traders to understand how they work and what behaviors they exhibit in different market conditions.
The DIX and GEX are built on inferring MM behavior to predict short-term market movements.
Dark Index (DIX)
The DIX is based on a little known idea that most short-selling activity in markets is actually from MMs. Yup, MMs do a LOT of short-selling, but why would they when shorting is very risky? The reason for this actually stems from the risk-adverse nature of MMs.
Because MMs make money from fulfilling trades, they want to stay consistently market neutral. Ideally, market movements should not affect the profitability of MMs. As such, MMs don’t want to hold any trade positions; no longs and no shorts.
But what happens if a trader buys from an MM? If the MM typically doesn’t hold any stock how do they sell to the trader? The answer is the MM sells short (that is, sell a stock that they don’t own). Once they sell short, the MM immediately tries to close the short position by buying stocks from traders that want to sell.
If you find it hard to believe the majority of short-selling volume comes from MMs, check out data from the SEC where about 49% of stock trades are marked with the seller “short”. Short-selling is highly speculative and it’s highly unlikely that non-MM market participants are pervasively selling short.
The primary principle behind the DIX is the understanding that short-selling often implies that non-MM market participants are buying (thus resulting in MMs selling short). In other words, the more short-selling there is, the more likely the market is actually bullish.
Because real-time short sale volume for public stock exchanges isn’t readily available, the DIX uses a proxy. Besides public stock exchanges, trading also happens in “dark pools”, which are exchanges that don’t have visible orderbooks and are mostly used by institutions to trade large blocks of stocks. Although little known, dark pools surprisingly account for a large portion of overall stock trading volume (about one third).
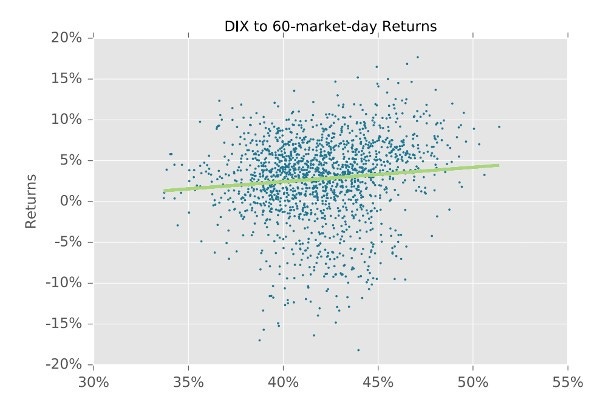
Conveniently, dark pool short sale volume data is readily available through FINRA and is a good approximation of overall short-selling volume, given how much volume occurs in dark pools. Also keep in mind that most of this volume is from well-informed institutions. The DIX indicator is based off of dark pool short sale data. The higher value of the DIX, the more short-selling has occurred, and the more likely the market is bullish. This can be seen in the chart below where there is a slight positive correlation between the DIX and 60-market-day returns.
As such, a trader can use the DIX as another way to gauge where the market is headed. A high DIX means that the market is likely going up, since more people are buying, and vice versa for a low DIX.
Thankfully, SqueezeMetrics makes the DIX available here.
Gamma Exposure (GEX)
Like the DIX, the GEX is also built on MM behavior. While the DIX is focused on short-selling volume, the GEX is focused on options. MMs are in all sorts of markets, and the options market is not spared of their presence. However, because the options market is significantly less liquid than the stock market, options MMs often have to hold many open options positions even though they still want to remain market neutral. As such, they rely on a unique mechanism to hedge their options positions called “delta hedging”.
This will be slightly technical, but bear with me (or skip below to the underlying simplified principle). Delta hedging relies, unsurprisingly, on the concept of the delta of options contracts. The delta is how much an options contract’s price changes when the stock’s price changes by $1. For example, a delta of 20 means that if a stock moves by $1, the options contract’s price moves by $0.20. As such, if an MM buys a call contract (representing 100 shares) with a delta of 20, then they would sell short 20 shares to keep their book value the same despite the change in the stock’s price.
Put succinctly, options MMs buy or sell shares to hedge their open options positions to remain market neutral, and the amount of shares they buy or sell is dependent on the delta of each options contract.
However, the delta of an options contract is constantly changing based on the underlying stock price, so options MMs also need to constantly adjust their hedge size to match the delta. For example, if the delta of a call contract owned by an options MM increases by 10, then the MM needs to sell short 10 more shares on the stock market. This change in delta is known as “gamma”.
Gamma Exposure, or GEX, basically sums up the gamma of all open options positions for a stock or index and provides an approximate view of how many shares MMs need to buy or sell to remain market neutral when the underlying stock price changes.
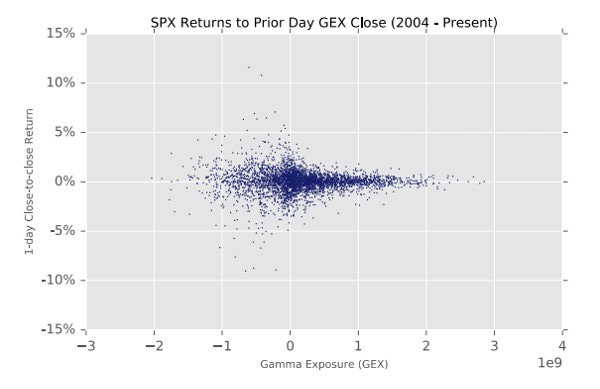
There are some more complexities to the GEX that I won’t dive deeper into here (watch out for an article explaining options in detail in the future) but the primary takeaway from the GEX is that a negative value means that options MM hedging activity introduces volatility in the stock market, while a positive value means that the same hedging activity introduces stability.
Negative GEX also means that there are more put contracts open for the stock or index, implying that the market is bearish, while a positive GEX is the result of more call contracts and thus a bullish market.
GEX is useful for a trader to gauge volatility of a stock or index and is especially interesting when it gets negative. The more negative it is, the deeper the stock’s price will tend to fall, yet super negative GEX values also mean that options MMs become at risk of what is known as a “gamma squeeze”. This results in violent price jumps for heavily sold stocks. As such, GEX can be a good buy or sell signal to time short-term volatility.
Fortunately, just like the DIX, SqueezeMetrics makes the GEX available here.
Fin
The DIX and GEX are excellent examples of applying a deep understanding of market mechanics to develop unique indicators which provide a better view of the overall state of the market. Today’s markets might be vast and complex but it certainly pays to understand its mechanics, and it’s even better if the complexity can be boiled down to simple indicators. Kudos to SqueezeMetrics for developing the DIX and GEX.
I hope this article has helped you understand DIX and GEX, and also helped shed light on some very interesting mechanics around how the behavior of pervasive market makers can move markets.
The in-depth and more technical papers on the DIX and GEX by SqueezeMetrics can be found here (DIX) and here (GEX). In addition, I found this article very helpful as a supplemental resource to understanding the GEX.


