
Simple but Comprehensive Starting Guide to Trading

Have you ever wondered if there's a prolific stock picker within you that just hasn't been realised? Maybe, maybe not, but there's no downside in learning. This article is simple enough for the layperson yet informative enough to be inspirational and will jumpstart your understanding of equities trading. Let's go.
Before we begin, you might wonder about my qualifications. I've been trading cryptocurrencies and equities for a few years now, starting during the 2017 cryptocurrency bull market. After lots of testing and learning, I started to hit my stride a year ago and found great success in the equities market. Here are my returns for the past 9 months.

Basic concepts
Stocks are traded by buying and selling them. The most common ways stock brokers allow you to do so are through two types of orders: MARKET and LIMIT. Each type is further divided into two subtypes, buying or selling. When you create a market order, you buy or sell the stock at the best price available right now, no matter what it is. When you create a limit order, you pick a price and the order is only filled if the chosen price (or better) can be met. Limit orders stay active until they expire or are cancelled.
But what exactly are you buy or selling from? What determines a stock's best price at any given time? This is determined by the ORDER BOOK. Every stock has an order book that contains how many stock units are available to be bought or sold at each price point (by summing unfilled limit orders). The book has two sides, a buy and a sell side. The buy side contains unfilled limit buy orders and the sell side contains unfilled limit sell orders. Buyers want cheap prices so unfilled limit buy orders have prices that are almost always lower than unfilled limit sell orders. As such, the highest bid on the buy side is thus the best price to sell a stock, and the lowest offer on the sell side is the best price to buy a stock.

Now that you know how buying and selling stocks work, let's cover the two main types of bets you can make. A bet, otherwise known as a trading position, can either be long or short. A long position is betting on the stock increasing in price, and vice versa for a short position. For long positions, you're typically just holding a stock and selling it in the future when it's price has increased. For short positions, you're borrowing stock, selling for cash, then buying back in the future when the stock's price is cheaper and finally, returning the stock.
Trading strategies and decision making tools
Trading strategies are classified by how long you intend to hold a stock. The three common classifications are: day trading, swing trading, and investing. Day trading, as the name suggests, means holding positions for no longer than a day. Swing trading is focused on the medium term and hold positions with the intention to exit within a few days, weeks, or months. Investing means to hold long positions till retirement. Very few people hold long term short positions.
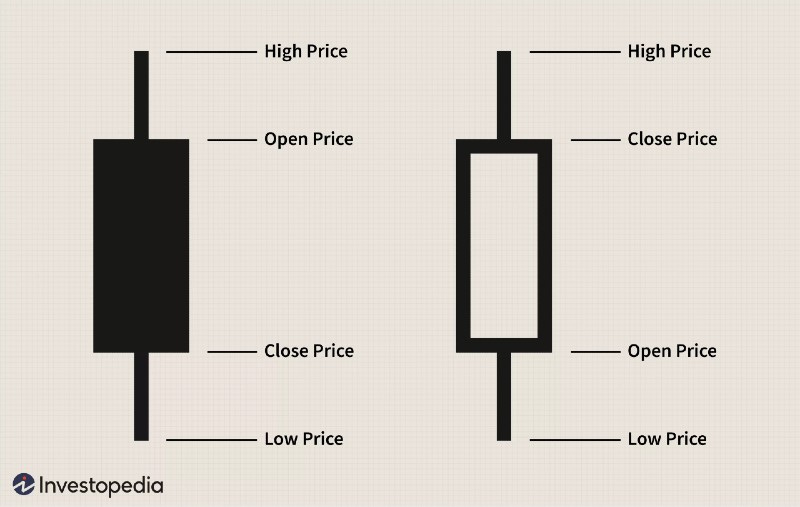
Trading strategies are only successful when paired with decision making tools, with the most necessary of which being the price chart. The best way to view price charts is TradingView.com, a free and intuitive website containing price charts of stocks, cryptocurrencies, and other major asset classes. Price charts are typically viewed in candlestick-mode. A candle is easy to red. Each candle represents a time period (e.g. 5 min, 15 min, 1 hour) and its color indicates whether the price has fallen (red) or increased (green) during its duration. If red, the top of the solid candle body is the price at the start of the candle and the bottom of the solid body is the closing price. The opposite is true for a green candle. The wicks of the candle represent the minimum and maximum price for the candle's time period.
Price charts are used to understand what a stock's price was in the past and what it is in the present. To predict the future, technical and fundamental analysis are used. Technical analysis relies on historical prices to predict future prices. For example, if a stock's price has increased aggressively over the past week, it's highly likely to pull back. Fundamental analysis relies on information about the underlying company to predict future prices. For example, if you believe that Apple's electric vehicle will be successful, then Apple's stock price should be much higher in the future as it gets closer to launching and selling EVs.
Technical and fundamental analysis
Technical analysis is mainly performed with trading indicators. Indicators are math calculations performed on historical price and volume data to create a new chart, usually plotted with the price chart, that can show signals to buy or sell. For example, the Relative Strength Index (RSI) is an indicator calculated through a complex formula using prices from the last 14 time periods to yield a new value between 0 and 100 that indicates whether a stock is overbought or oversold. This is just one example of many many trading indicators used by novice and experienced traders alike, and most of them are free-to-use on TradingView.
Fundamental analysis is done by learning as much as possible about a company. Examples include listening to earnings calls, reading company financial sheets, and paying attention to the news. The information gained lets you make a prediction on the company's future business prospects, be convicted about the prediction, and continuously evaluate this prediction with new information. Fundamental analysis is hard work and often requires creativity and ingenuity to dig up and evaluate esoteric morsels of information about a company. The buck doesn't stop at fact finding; an educated guess needs to be made and an even harder period of waiting ensures as the rest of the market either confirms your prediction or rejects it. A popular trading adage is that markets can remain irrational longer than you can remain solvent.
Trading psychology and limiting risk
Until your hard earned money is on the line, it's hard to imagine how emotional trading can be. Imagine if you bought TSLA at $400, then sold when it dropped to $300, and now the stock is at $1000. This is a devastating feeling. Not only did you miss out on a 150% move, you lost 25% despite making the right decision at the start. Here's another example. Imagine buying TSLA at $400, selling it at $500 to book a nice 25% profit, then seeing it go to $700, and jumping back in only for it to fall back to $350. Again, despite making the right initial decision, it ended as a -37.5% loss.
Bad trading decisions invoke strong negative emotions that, if unaddressed, affect future trading decisions. This starts a destructive cycle that ruins a portfolio. A trader needs to reign in their emotions and focus on the future when entering new trades. Like most things, it's easier said than done but experience teaches valuable long term lessons.
While emotional control is an innate ability that can be honed, there are ways to eliminate emotions from trading. One of the best ways to do so is to limit risk. A popular risk-management strategy is to put a ceiling on the percentage of your portfolio you're willing to lose for each trade. This percentage varies for every trader. A popular percentage is 1% (known as the 1-Percent Rule) but you can also use the Kelly Criterion to determine a personalized risk percentage. Whatever that value is, the idea is sound. Keeping the risk low on each trade prevents your portfolio from being blown up from mistakes or bad luck, giving an otherwise successful trade strategy time to play out.
There are two primary ways to limit risk. You can use a stop loss or, as famed hedge fund manager Jim Chanos prefers, to limit each position size to a percentage of the portfolio. A stop loss is another type of trade order where you basically tell the broker to exit a position if the stock's price goes to a certain point. For example, if you bought AMZN at $3000 and set a stop loss at $2700, if this trade goes sour, you're losing at most 10%.
One downside to using stop losses is potentially exiting at a worse price than the stop loss price because there isn't enough interest on the other side of the order book to help you exit at the target price. This could be caused by a fast moving market or having a large position. Another downside with stop losses is that they are vulnerable to market volatility. The market could swing wildly in one direction in the short term, triggering your stop loss, before moving in your predicted direction.
On the other hand, although the latter strategy of limiting every position's size to a small percentage of the portfolio avoids these problems, the downside is that a small position means small profit.
Parting advice
Although this article won't instantly make you a trading expert, it should be inspirational and jumpstart your trading education. I part you with some disparate but valuable advice:
Find a set of trading tools that gives you the most important information as efficiently as possible
Find experts to learn from. Many experts share their insights in books or online. Find a set of experts to learn from and follow their videos and articles. For example, you can often find great financial analysis on the RealVision YouTube channel
Most novice traders start with a tendency to hold a winning play for too long. Learn to let your winning trades run but also learn to take profits and don't fall in a love with a trade
Before starting to trade, be explicit about your trading strategy. List the conditions that need to be true before entering a trade and have a clear exit plan for both a winning and losing situation
Keep a "trading diary" of all your trades, taking notes of both the winners and losers and why they played out the way they did. It's especially important to find lessons in your losers and adjust your trading strategy