Thinking In Probabilities
The fundamental axiom that almost everyone gets wrong in investing: you cannot predict the future with certainty. Here's how to Think In Probabilities.
The fundamental axiom that almost everyone gets wrong in investing, even if they often don’t realize it, is that:
You cannot predict the future with certainty!
Yet almost every financial commentator talks about the future with certainty.
We think this stock will go up”, “we think inflation will go down”, “we think a recession will happen next year”.
It’s easy to make this subtle mistake. History happens with certainty, there’s less danger in certainty, and so it’s easy to want to think of the future with certainty.
I bet I’ve made this mistake a lot as well in the hundreds of past FinanceTLDR issues that I’ve written.
In this issue, let’s discuss how to become a better investor by Thinking In Probabilities.

The preeminent tool for Probability Thinkers is the probability density function.
I’ve shared a visualization of one below.
In probability density functions, points on the horizontal axis represent events that could happen. The vertical axis represents the probability of the outcome happening (e.g. 20%). The area under the curve always sums up to 100%.
The Standard Normal Distribution, often referred to as the Bell Curve, shows a very common sense probability density function.
The most typical outcomes, near the center of the x-axis, have the highest probabilities. The tails of the distribution, representing more extreme outcomes, have the lowest probabilities.
The normal distribution can be used to model many common phenomena, like human heights, test scores, and ostrich egg sizes.
Most importantly, in the context of FinanceTLDR, normal distributions can model stock price movements.
The Probabilities of Stock Prices
Consider the stock Zillow, ticker symbol $Z.
Its current price, at the time of writing, is $45.45.
Without having any special information, how would you model the probabilities of changes in the stock price at market close tomorrow?
You probably guessed it. The commonly accepted way to model this is with a normal distribution with the variance as the time-weighted average 1-day variance of the last, say, 30 days.
In other words, if Zillow’s stock price had been moving a lot recently, it’ll probably move a lot tomorrow, and vice versa.
Probability density functions have different shapes. The two most common measures of their shapes are kurtosis and skewness.
Kurtosis
Kurtosis is a measure of the “tailedness” of a distribution.
Tailedness means how often the extreme outcomes of an event occur. If the chances of extreme outcomes are high, the areas under the far edges of the distribution, known as the “tails”, are large.
More formally, there are 3 general classes of kurtosis for probability density functions. They are:
Leptokurtic (more kurtosis): large tails, extreme events happen more often.
Mesokurtic: closer to a standard normal distribution where tails are “normal” size.
Platykurtic (less kurtosis): thin tails, extreme events happen less often.
Leptokurtic distributions are the bane of money managers. They don’t like extreme negative outcomes, which are often non-ergodic and bankruptcy-inducing.
Skewness
Skewness is a measure of the asymmetry of a probability density function.
If positive outcomes are more likely, the right side of the probability density function is larger, and the distribution is said to have a positive skew.
If negative outcomes are more likely, the left side of the probability density function is larger, and the distribution is said to have a negative skew.
Going back to the Zillow example.
If one has extra information that suggests Zillow will go up tomorrow (e.g. the CEO is going on CNBC to talk about a new business initiative), your probability density function for Zillow’s stock price tomorrow would be positively skewed.
A Quick Example: Chinese Equities
Here’s a relevant real life example to model the probabilities of.
What do you think the market’s consensus of the shape of the probably density function for the price movement of Chinese equities one year from now is?
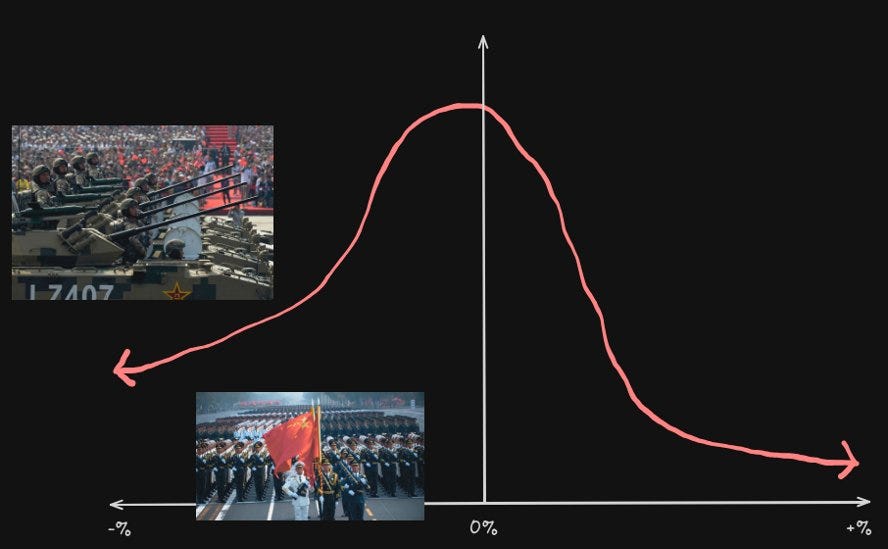
Given all the rhetoric and actions of the Chinese government in the past few years, it’s not unreasonable to think that the probability density function for Chinese equities has high kurtosis with very negative skew.
For example:
The negative tail risk of military action across the Taiwan Strait is of great concern, especially among Asian fund managers who are closest to the action.
This is a major reason behind the Chinese stock market’s ongoing three-year-long bear market.
I Saved The Best For Last
One of the coolest things you can do when you really internalize thinking in probabilities is to integrate buying and selling probabilities into your investing framework.


