How Expiring Options Move Markets
In 7 minutes, understand what vanna and charm flows are and how they move markets.
This is going to be a tricky newsletter issue to write.
The concepts I’m attempting to explain are very complex, yet are also very important to understanding how the market moves.
I’ll try my best to make it as easy-to-read as possible.
💡 Two Important Market Predictions
Here are two predictions for how the S&P 500 (referred to as the “market”) will move in the next few weeks.
First, the market will run up into the close tomorrow.
This is because a significant number of options will expire at day’s end. It’s called the February Options Expiry date or February OpEx.
The third Friday of each month is known as the monthly OpEx and these monthly OpEx’s harbor the vast majority of open options contracts.
The vanna and charm flows from these expiring options intensify as they near expiry, resulting in significant buying that pushes the market up into the close.
Fret not, I will soon explain vanna and charm.
Second, we enter a “window of weakness” next week as the vanna and charm flows disappear and the market has less buying support.
If the market doesn’t sell off during this time, the vanna and charm flows from March’s OpEx start taking over and significant buying support returns.
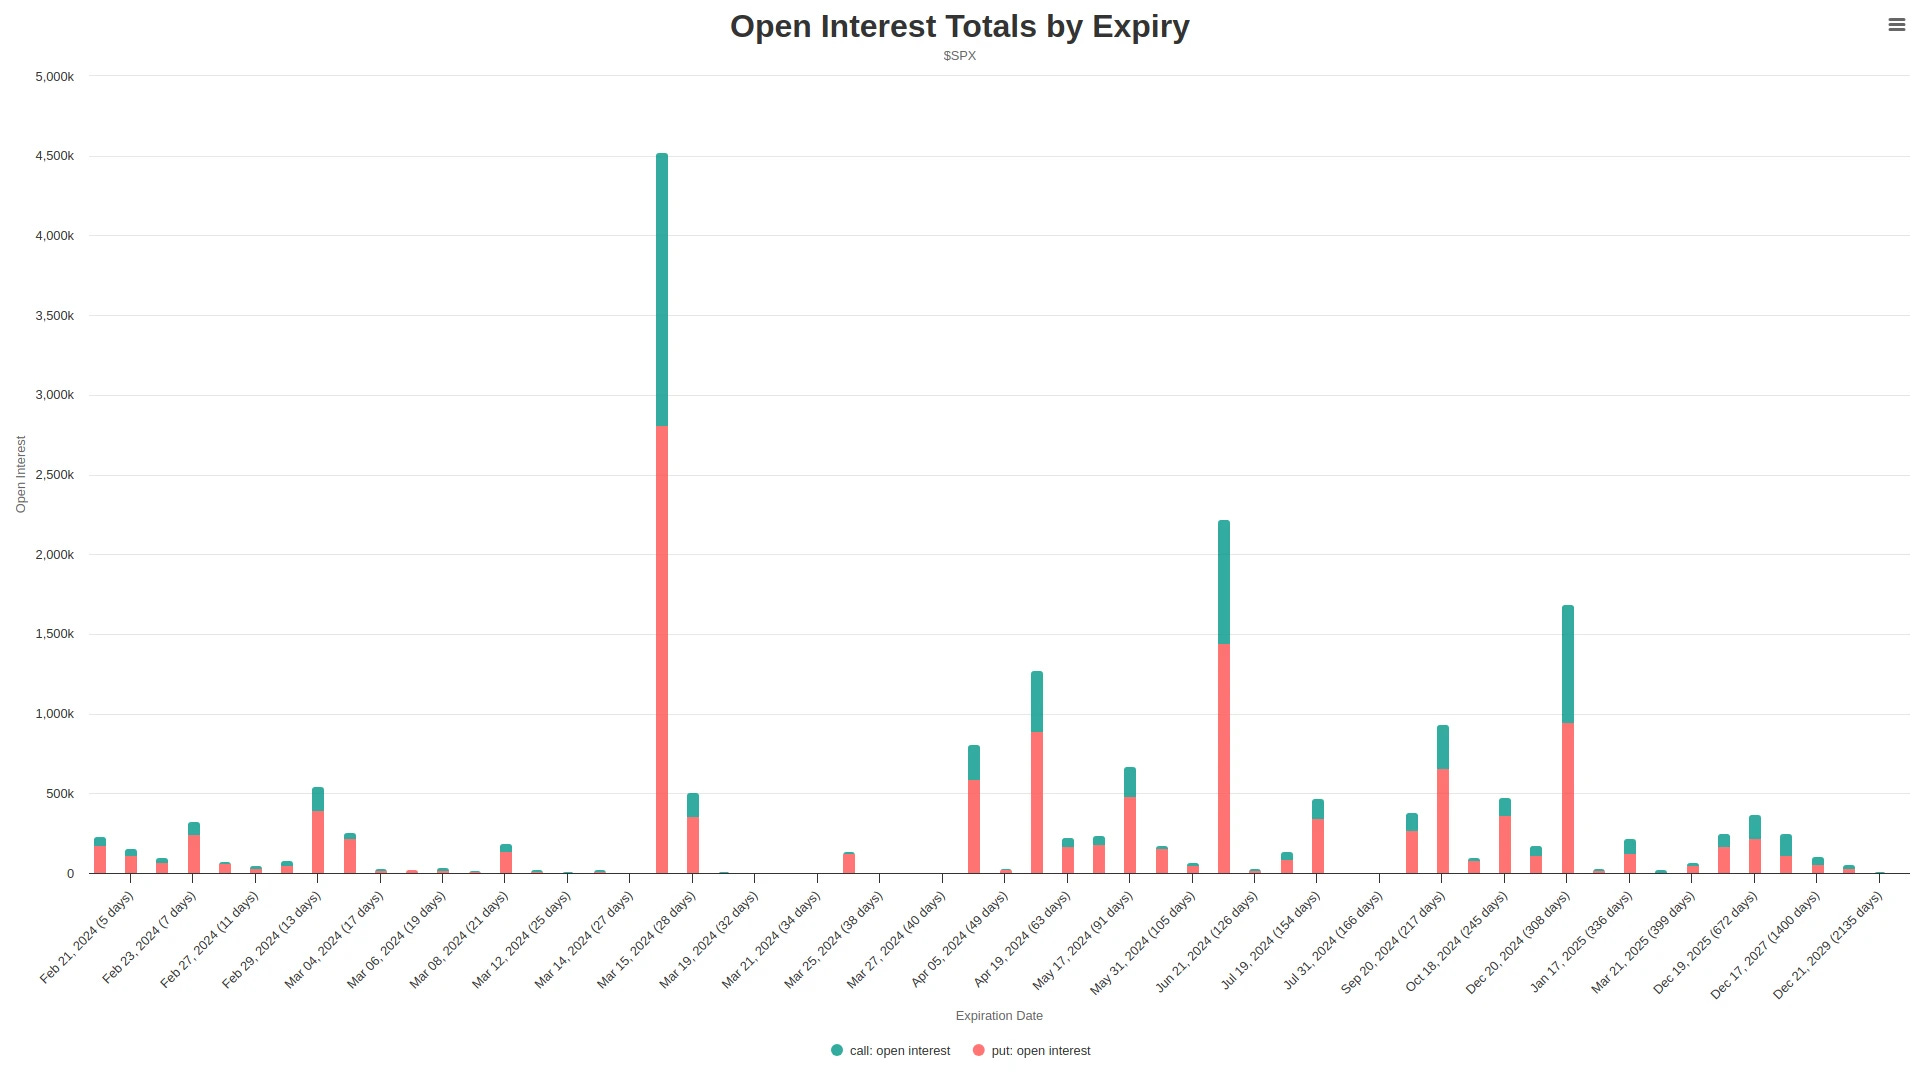
The vanna and charm flows from March’s OpEx are huge because it’s a quarterly OpEx which has even more open options contracts than other monthly OpEx’s.
These flows have a high chance of rocketing the market upwards into the March OpEx, on the condition that a market sell-off doesn’t happen in between.
💡 What’s Vanna and Charm?
A large portion of the market is invested in funds that track the S&P 500 index.
This could be through direct investments in popular S&P 500 ETFs like SPY and VOO or indirectly through 401ks, private wealth management, roboadvisors, etc.
The S&P 500 is synonymous with the US stock market and has performed incredibly well, returning over 12% per year on average in the last 10 years. No wonder so much of the market, and even the world, is invested in the index.
When you’re invested in the S&P 500, you want to hedge against market downturns.
For example, the market sold off by a third during the pandemic. Not good. As such, there’s high demand for portfolio insurance to weather turbulent markets.
One of the most popular ways to hedge against market downturns is to buy put options.
Put options are safe in the sense that the price paid for them is the final price and there’s no risk of owing more than what you paid for, which is a risk if you shorted the S&P 500. They are also relatively cheap, while still paying off in spades if the market does sell off. Finally, put options that expire worthless also conveniently incur capital loss.
So the market tends to buy a lot of put options on the S&P 500.
Investors, not surprisingly, also like money. If they could earn extra yield on top of their S&P 500 investment, they would try to.
A popular way to earn yield on top of an S&P 500 investment is to sell call options.
Selling calls on the S&P 500 can be quite lucrative and it’s safe. If the S&P 500 goes above the strike price of the sold calls, you can either “roll” the sold contracts to a later date or sell your shares at the strike price and then buy back in.
Like owning put options, selling call options doesn’t put the investor at risk of margin calls.
So, we have come to an important intermediate conclusion: the S&P 500 structurally has lots of put buying and lots of call selling.
In practice, there’s a lot more put buying than call selling. Portfolio insurance is in high demand.

The next thing to understand is that when the market buys puts and sells calls, they are often transacting with an Options Market Maker (MM) such as Citadel.
As such, when the market buys S&P 500 puts, the MM is selling the puts. When the market sells S&P 500 calls, the MM is buying the calls.
When the MM sells puts, it takes on what is known as “positive delta”. MMs want to be delta-neutral and offset this positive delta by shorting S&P 500 futures to go delta-neutral.
A similar thing happens when MMs buy calls. They take on positive delta as well when they buy calls and need to short S&P 500 futures to go delta-neutral.
The end result is that MMs are often net short the S&P 500.
Sweet, we’ve come to another important intermediate conclusion: the popular put buying and call selling of the S&P 500 means MMs, who are taking on the other side of these trades, often end up being net short the S&P 500.
Now, we can discuss what vanna and charm flows are.
The price of options contracts takes into account the volatility of the stock. The greater the volatility, the more expensive the contract is.
The farther into the future an option's expiry date is, the more volatility there is. Volatility is also positively correlated with the number of significant market moving events (e.g. earnings) that happen before the contract’s expiry date.
As time passes, and these market moving events happen, an options contract’s volatility decreases and its price falls.
As the options contract’s price falls, the MM needs to short less stock to remain delta-neutral. As such, they will buy back shorts as the options expiry date draws near.
This buying back of shorts is known as vanna and charm flows. The closer we get to the options expiry date, the stronger the vanna and charm flows are.
This is a very rough explanation of vanna and charm flows so that we can quickly impart the main idea that these flows are buying flows from MMs as we near options expiry dates.
The more bought puts and sold calls that are expiring, the greater the vanna and charm flows. The closer we get to options expiry, the stronger these flows get.
It took a lot of complexity to get to this main idea so feel free to ask us questions, we’ll try our best to answer them in detail.
💡 Putting the Predictions Into Context
So, for the first prediction, why do I think the market will run up today?
Because today is a monthly OpEx (February) and given that many people were bearish for this week yet the markets didn’t fall, there is a larger than average amount of puts expiring into the close.
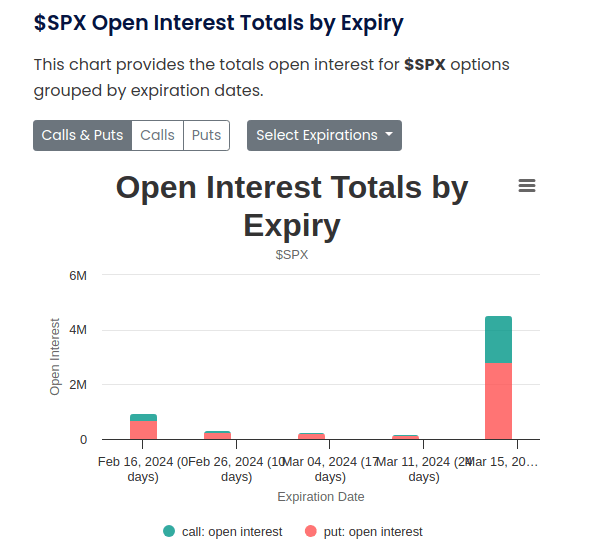
Look at the tremendous skew towards puts. The put-call ratio is 2.84. That’s a lot of puts that are expiring today. As we near 4pm EST, the vanna and charm flows for these puts intensify exponentially, pushing the market upwards.
For the second prediction, next week will be what some refer to as a window of weakness as the vanna and charm flows of Feburary’s OpEx disappear.
The next OpEx is March. It’s a big one given that it’s a quarterly OpEx. Institutions like to trade in quarterly options so these OpEx’s have an extra large amount of options open interest.
For example, consider the JP Morgan’s fund the JHEQX, commonly referred to as the JPM Collar. The fund has almost $20 billion in assets and primarily invests in the S&P 500. Each quarter, the fund creates an insurance “collar” around its S&P 500 investment by selling calls that are around 5% out-of-the-money to buy puts that are around 5% out-of-the-money. The JHEQX trades in quarterly OpEx’s.
This large quarterly OpEx open interest has two main implications:
If the market does sell off in between next week and the March OpEx, it will get violent as the gamma of the massive amount of open puts for the March OpEx takes over, resulting in negative selling reflexivity (selling begets selling). More on gamma in a future issue.
If the market does not sell off, then the large vanna and charm flows of March OpEx take over and it’ll be a monstrous rising tide washing over the market, significantly driving prices upwards.
These are the two scenarios I’m watching out for. How the market moves next week will be a very good indicator on which scenario will play out.
For now, it’s prudent to take a wait-and-see approach.


I have several questions and they're kinda all over the place haha. I appreciate any time you can give to answer as many as you are able. I understand some are large questions and basically asking for another newsletter.
1.
How do MMs make money if they're usually short, and S&P usually rises?
2.
"If the market does not sell-off, then the large vanna and charm flows of March OpEx take over and it’ll be a monstrous tide that will skyrocket the market."
Would this be indicated by lower than normal trade volume that slowly rises into Mar Opex?
I'm taking the understanding that these Vanna & Charm trades are an undercurrent of trade volume that always exist (so long as these big investors want "insurance"). Then the "window of weakness" would refer to an absence of us everyday retail traders, right?
3.
The put/call ratio looks much more even for Mar OpEx compared to Feb OpEx of 2.84:1. How does that affect the price direction?
4.
Where can I get access to charts like the ones you shared?
5.
I'm lost on how the potential liquidity crunch (ON RRP depletion) ties into this. I'm reading your "Market Pulse: Liquidity is Surging" newsletter as I write this, but my understanding of Bank Reserves, US Treasuries and how that influences MM and other major retail investors is lacking.
I trust the general concept that it means a depletion of liquidity, and depletion of liquidity means they bow out of the market - but I do not fully understand the motivation/decisions that would be made by Institutions. I'll re-read and find supplemental info to see if that sparks an understanding.
6.
On that same note, your other newsletter "The Banking System was Redesigned" explains that the Fed has gone from manipulating interest rates as a means to control liquidity, to now they directly control liquidity with Ample Reserves (infinite money). This sounds like the impending liquidity crunch would dictate the Fed initiates QE again, and thus is a non-issue? Like isn't that the exact scenario that Ample Reserves is meant to tackle?