Where Did Inflation Come From?
As this year draws to a close, let's review charts, stats, and figures to understand the origins of this year's inflation so that we can learn from the past to be better forecasters of the future.
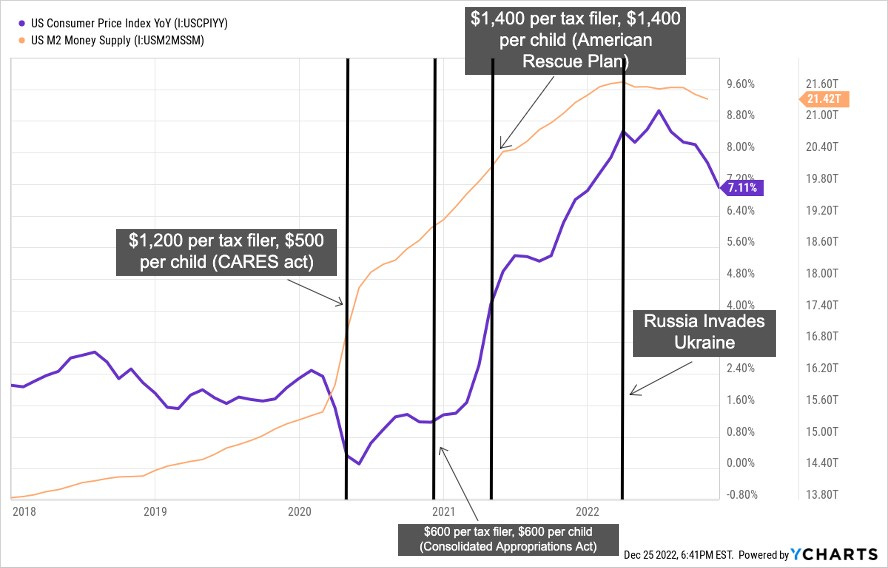
In the formative months of the pandemic, the government inundated the economy with a tidal wave of money through a series of stimulus policies. These policies are arguably the primary drivers of inflation today.
This newsletter issue will review charts, stats, and figures related to the origins of today’s inflation so that we can learn from the past to be better forecasters of the future.
Trillions of Stimulus

The pandemic’s fiscal stimulus policies are most commonly associated with stimulus checks but they were certainly not all or even the majority of the money printing. Here are some other examples of the Federal government’s money-printing programs:
Paycheck Protection Program: a total of $792.6 billion in loans went out to 11.5 million small- and mid-sized businesses. Over $742 billion of those loans ended up being forgiven.
State and Local Fiscal Recovery Fund: $350 billion sent to states and cities.
Coronavirus Relief Fund: $150 billion sent to states and cities.
Provider Relief Fund: $134 billion sent to hospitals and other healthcare organizations.
Restaurant Revitalization Fund: $28.5 billion sent to restaurants.
And many more…
In total, $3.95 trillion of direct economic stimulus was injected into the economy by the Federal government in under 18 months!
Besides direct economic stimulus, moratoriums on student loan repayments and rent payments also indirectly introduced even more money into the economy. In fact, the student loan moratorium is still in place and won’t go away until next year August.
While the Federal government dumped loads of free money into the economy, the Federal Reserve used its monetary policy powers to do the same thing:
Zero Interest-Rate Policy: the Fed Funds Rate ceiling was cut from 1.75% to 0.25%, making borrowing money significantly cheaper across the economy.
Quantitative easing: the Fed purchased trillions of dollars of US treasuries and mortgage-backed securities. Its balance sheet ballooned by almost $5 trillion in under 2 years ($4 trillion → $9 trillion). This helped to fund the fiscal stimulus policies described above and also overheated the housing market.
Corporate Credit Facilities: $750 billion to buy corporate bonds and bond ETFs.
Term Asset-Backed Securities Loan Facility: $100 billion to loan to corporations. Corporations could post risky asset-backed securities as collateral for the loans.
Main Street Lending Program: $600 billion to purchase loans from small- and mid-sized businesses.
Municipal Liquidity Facility: $500 billion to purchase short-term notes issued by states, counties, cities, and other municipal organizations.
And many more…
Putin’s Price Hike?
Earlier this year, Biden attempted to blame the war in Ukraine for the ongoing inflation by branding it “Putin’s price hike”. At face value, this makes sense given that energy costs affect almost every other cost in the economy. However, on close inspection, this blame doesn’t pass muster; when the war started, inflation was already at over 8% and had been rising for close to 2 years.
The war didn’t cause inflation, but it certainly aggravated it.
Supply Breakdown
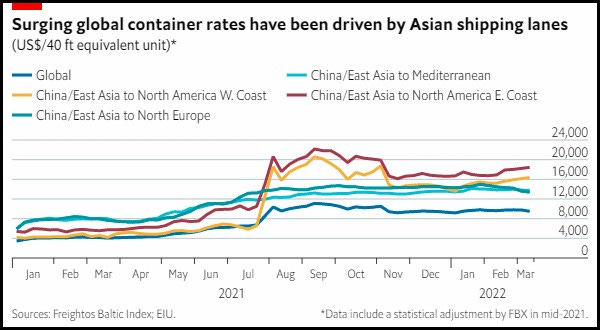
While the US government dumped trillions of dollars into the economy, global supply contracted aggressively as factories all over the world closed down and ports couldn’t find enough workers to keep shipping containers moving.
With so much new money chasing fewer goods, it’s no wonder that prices started to rise.
Supply was also heavily affected by a shrinking domestic labor force in the US. Even as the pandemic subsided and the economy reopened, a labor shortage continues to plague the US today as people aren’t returning to the work force.
The current Labor Participation Rate remains stubbornly lower than pre-pandemic levels while consumption demand has remained historically high. This has unsurprisingly resulted in significantly more jobs chasing fewer workers.
In fact, according to Goldman Sachs, there are 4 million more jobs than workers in the economy right now.
The ongoing labor shortage is the Fed’s foremost concern in its fight against inflation. Labor shortages cause super-sticky Wage-Price Spirals that keep inflation elevated.
How Did We Miss This?
Both the Federal government and the Federal Reserve have an army of PhD economists running around so how did they miss the inflationary impacts of their inordinate money printing during the pandemic?
This is likely because we have become so accustomed to the low inflation environment of the past decade that the automatic response to an ailing economy was to print money and stimulate demand. Policy makers took for granted the ability of global supply to keep up with demand.
To put the recent low inflation in perspective, here are the annual inflation rates of the US in the years leading up to 2020:
2013: 1.50%
2014: 1.60%
2015: 0.12%
2016: 1.26%
2017: 2.13%
2018: 2.44%
2019: 1.81%
Inflation has practically been non-existent even as the Federal Reserve expanded its balance sheet in the early 2010s to over $4 trillion and kept the Fed Funds Rate close to 0%.
This low inflation environment, despite significant monetary stimulus, conditioned our government to assume that simply stoking demand was a panacea for any future economic problems.
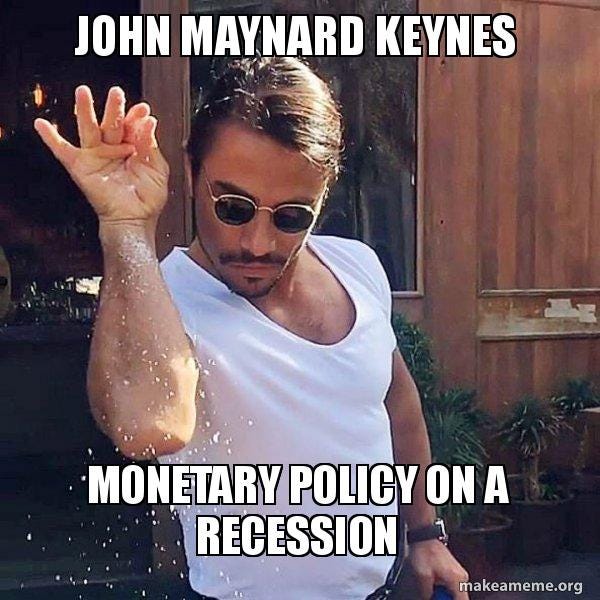
As an aside, this is a very Keynesian economic perspective and John Maynard Keynes would’ve been proud.
Fin
Hindsight is 2020 but it must be said that during the pandemic, the deadly unknowns of the virus coupled with the low-inflation conditioning of the past decade resulted in too much money printing without considering whether a lockdown-stricken global supply chain could keep up.
Turns out, it couldn’t.
Ergo, we have today’s inflation.


