
Market Pulse Premium: Bounce
A quick but important follow-up to the previous issue.


So this is a quick follow-up to the Market Pulse Premium issue I sent out on Sunday evening.
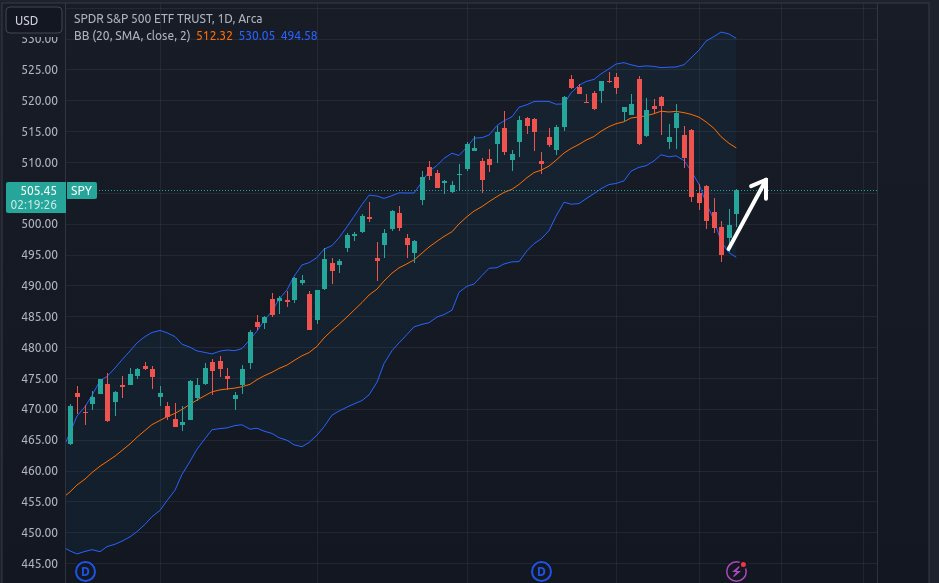
In it, I wrote that I expected a bounce this week and I think this bounce has legs until around the mid Bollinger Band line.
These were the probabilities I gave for this move:
What are the probabilities? Here’s what I think:
Bounce next week (65%) / Selling continues over the next week (35%)
Bounce in two weeks (85%) / Selling continues over the next two weeks (15%)
The past two days have shown that this was the right call.
Below is the chart I shared in that issue for the S&P 500. This is a daily chart.

Let’s see what this chart looks like now.
Perfect!
So where are we headed to next? Here’s another look at the chart I shared last issue showing how the S&P 500 moved in a down market from late July to late October.

Be prepared to see choppy movement like this, if we’re really in the start of a major downtrend (which I think is likely to be the case).
What are the probabilities of this?
Major downtrend for the next quarter (80%) / Bull market returns after this bounce (20%)
Why do I think so?
