Market Pulse Premium: New Market, New Strategy
Direct and specific thoughts and predictions for the market.
This is the inaugural Market Pulse Premium newsletter issue.
The goal of this issue is to be straightforward on exactly what I’m thinking about for the markets right now:
Sharing predictions, with probabilities (Thinking In Probabilities)
How I plan to express these ideas in the market
Reviewing past ideas
The first Market Pulse Premium issue is open for everyone but future issues will be for Premium subscribers only.
ℹ️ Aside: Overall Framework
The overall trading framework that this issue is based on can be summarized as:
Having a point-of-view, with probabilities, is better than no point-of-view.
You cannot predict the future, so you must be okay with making wrong decisions.
Lean into the arithmetic mean over the geometric mean through fractionalization of bets.
Each idea gets a small portion of capital dedicated to it. Ideas with more conviction get more capital. Ideas with less conviction get less capital.
Concurrent bets should have minimal correlation so that a single market event doesn’t break several ideas at the same time and significantly hurt the overall portfolio.
Lean into asymmetrical risk-rewards.
In other words, the pay-off for being right should be significantly larger than the loss for being wrong.
If you’re only 10% better at coming up with right ideas than wrong ideas, with reasonable bet sizing and asymmetrical risk-rewards, you can generate significant returns.
Options is an example of an asset with asymmetrical risk-rewards. When an idea is expressed as an options position, it can pay off tremendously if you’re right (Keith Gill turned $53,000 to $50 million in two years) while if you’re wrong, you’ll at most only lost 1x.
Iterate fast.
Iterate fast on idea generation and trade execution. Fail fast, succeed fast, and review results often.
For more details, check out these two prior newsletter issues:
For premium subscribers, I elaborated on this framework in the document “Retail Multi-Strat Hedge Fund Emulation” that I’ve shared in the Premium Subscribers spreadsheet.
ℹ️ Aside: Determining Probabilities
I will share a series of probabilities below. You may be wondering how I came up with them.
They represent quick and rough point-of-views based on the qualitative aspects of the market’s recent historical behaviors.
One should interpret them as, “this is more likely to happen, here’s why”, instead of, “here’s a mathematical framework to show why the probability for this happening should be exactly X”.
Every new market environment is different from past environments with many unknown unknowns, so any process to quantify exact probabilities could itself be wildly wrong.
In the face of many unknown unknowns, I find it often better to rely on intuition (Daoism) rather than complicated and time-consuming processes to determine event probabilities.
However, I’m not saying that one should entirely eschew complicated and time-consuming processes. They have their place and I’ll use them when I feel that they’re appropriate.
As Charles de Gaulle observed in his meditation on leadership, The Edge of the Sword (1932), the artist ‘does not renounce the use of his intelligence’ – which is, after all, the source of ‘lessons, methods, and knowledge’. Instead, the artist adds to these foundations ‘a certain instinctive faculty which we call inspiration’, which alone can provide the ‘direct contact with nature from which the vital spark must leap’."
📉 We’re likely at the start of a new major downtrend
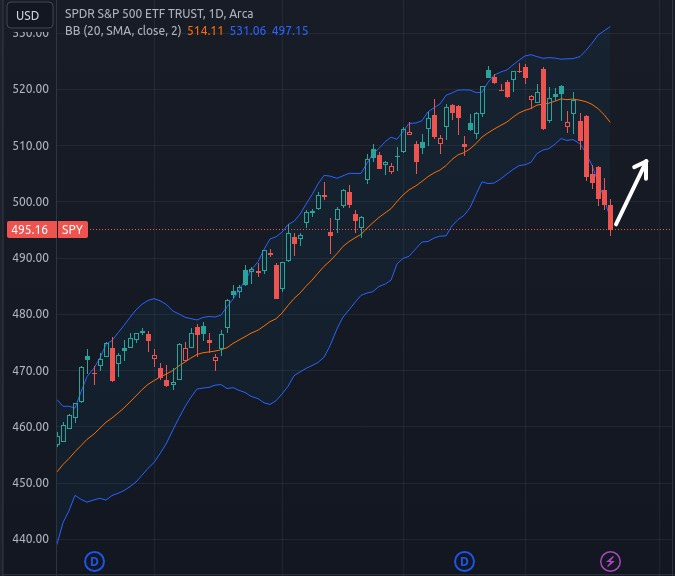
The S&P 500 sold off sharply last week.
6 red daily candles in a row, each pushing the bottom Bollinger Band (a 2 standard deviation negative move, with respect to the last 20 days).
At the same time, RSI collapsed from 65 to almost 30 after hanging above 60 for almost 5 months (since early November).
This was an extreme downside move that we haven’t seen for many months.
Typically, after such large downside moves, the market is liable to bounce and hit the mid Bollinger Band line, before selling off again.
Quick Bollinger Band TLDR: the middle BB line, as seen below in orange, plots a 20-period Simple Moving Average (SMA). The blue lines above and below are 2 standard deviation moves from the 20 SMA.

For example, below is how the S&P 500 traded last year from the start of Q3 (August) to the end of October. Lots of selling, a big bounce to the mid Bollinger Band line, more selling, another big bounce, and then even more selling.

In the past few years, S&P 500 has often exhibited this bouncy downtrend pattern during prolonged sell-offs.
💡 As such, I think that the market will more likely than not make one of these big bounces after last week’s significant selling.
What are the probabilities? Here’s what I think:
Bounce next week (65%) / Selling continues over the next week (35%)
Bounce in two weeks (85%) / Selling continues over the next two weeks (15%)
ℹ️ Aside: RSI and Bollinger Bands
Price indicators are derivatives of price movements.
Investors use indicators to have a better sense of short-term price action.
Why?
One principle is that short-term price movements are very probabilistic.
For example, the longer price has been pushing the 2 standard deviation line below the 20 simple moving average, the more likely it is to bounce in the short-term.
RSI and Bollinger Bands are very simple and popular indicators that, in my opinion, present the simplest view of short-term probabilities.
Don’t take it from me. These two indicators, especially Bollinger Bands, are very popular among options analysts, and options analysts are the best probability traders in the market.
📉 Shorting the short-term bounce
If the S&P 500 bounces within the next two weeks, the probabilities start to skew toward more selling when it touches or crosses the mid Bollinger Band line.
💡 At that point, I’m going to start looking to short the market.
What are the probabilities?
If a bounce to the mid Bollinger Band line happens within the next two weeks, the probabilities of the next move are:
Selling continues after the bounce (70%) / The market bounces or levels off (25%)
📈 Start preparing early for a long-term bounce
Although it’s very early to start thinking about a long-term bounce (assuming this is the start of a period of prolonged selling), it doesn’t hurt to keep the next long-term bounce in mind.
When the bounce comes, it’ll likely be large and very profitable, even if you don’t time the entry perfectly.
The market in the past few years has consistently and strongly trended upwards after a period of prolonged selling.
Just look at the non-stop buying from last November to the end of March. You don’t need precise timing to profit from such strong long-term upwards moves.
💡 When does this long-term bounce happen?
If I were to guess, I think the market sells off during the summer and bounces in early H2 (second half of the year). Perhaps at the end of July.
What are the probabilities of this happening? My rough guess is:
Long-term bounce starts in early H2 (80%) / Selling continues into the election (20%).
Why?
For one, stocks tend to rally hard in the few months before a Presidential election. The US Treasury, which works for the incumbent President, will work hard to add liquidity to the market to increase the chances of their boss winning.
In a Fiscally Dominant financial environment, the US Treasury has a lot of power to set the market’s tempo.
Another reason is that prior periods of prolonged market sell-offs in the past 4 years have not lasted for more than a quarter or two. It’s unlikely for this current sell-off, assuming it’s another big one, to be different from the others.
How could this idea go wrong? More war and more inflation later this year.
ℹ️ Interest Rates and Big Tech
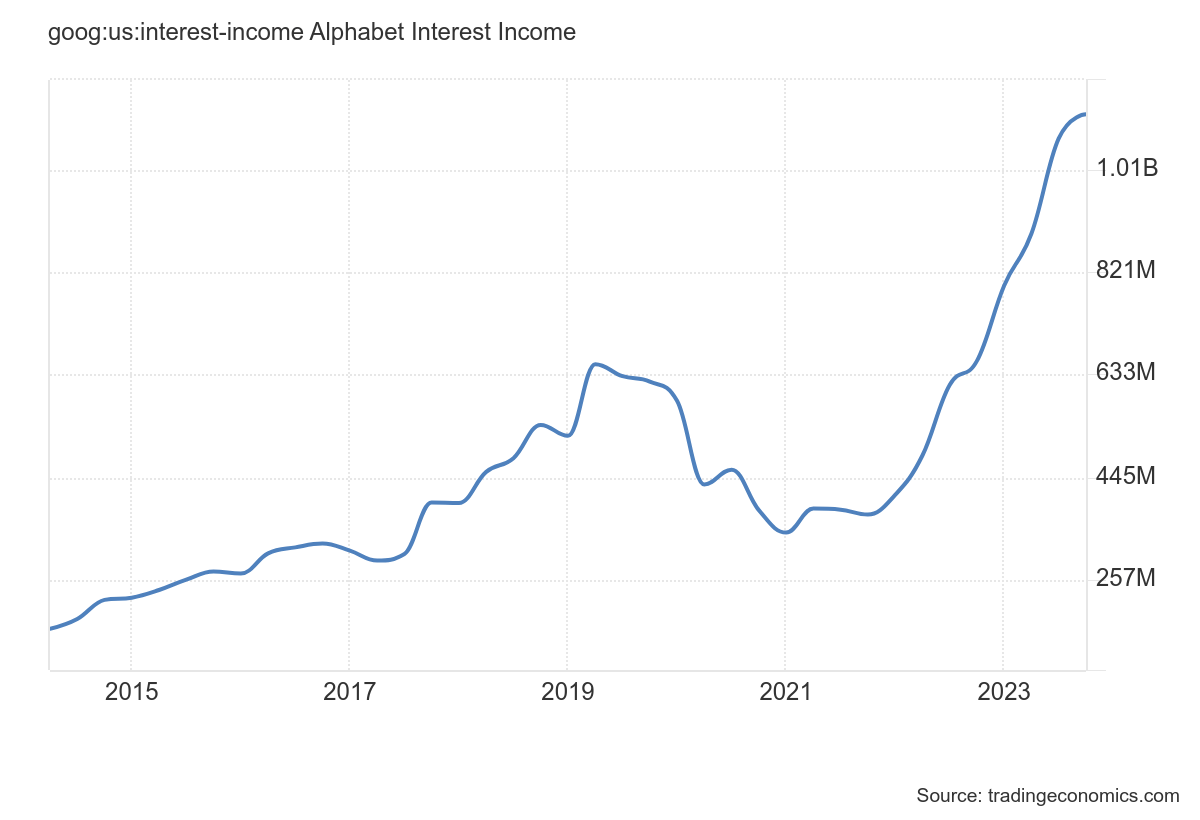
One idea I’ve been thinking about for a while now is how high interest rates actually benefit, rather than hurt, Big Tech companies.
Big Tech companies make so much money that they’re effectively liquidity suppliers for the rest of the market and don’t need to borrow money to sustain or grow the business. As such, they’re largely unaffected by high borrowing costs and instead will earn a lot more money lending out their constantly refilling or overflowing corporate treasuries at high interest rates.
Below are three charts showing how, as the Federal Reserve rapidly hiked interest rates over the past two years, Big Tech interest income has soared alongside rising interest rates.
Reviewing New And Existing Ideas
Short TQQQ (technology sector)
Ongoing idea. Working very well. Started the position on April 11th and I should’ve doubled down last week but made the mistake of obsessing over a perfect entry.
Short TLT (long-term US treasuries)
Ongoing idea. Working very well. A summer of hot inflation means greater expectations for higher interest rates. When interest rates rise, bond prices fall and vice versa.
Long ITA (defense sector)
Ongoing idea. ITA hasn’t moved much since I expressed the idea but the US House just passed a $95 billion foreign defense aid bill (Ukraine, Israel, and Taiwan) and this should be a big boost for the US defense sector (the Democrat-majority Senate is likely to ratify the House’s decision).
Long Z (Zillow)
With hot inflation, which means higher interest rates, the Z idea is not doing well. However, it’s a long-term idea (one year) and I see it as just being a bit early. Z has materially out-performed the real estate industry in the past year and I think it will continue to do so.
On the off chance that inflation does fall in the summer for whatever unforeseen reason, the Z idea will start working early.
In a way, the Z idea is a hedge against interest rates falling more than expected, even though my opinion started to shift towards higher inflation throughout the summer and thus higher interest rates.
Long INTC (Intel)
I still think Intel is a great hedge against TSMC troubles if China-Taiwan tensions worsen.
I was expecting the new CHIPS Act grants to be very positive for the stock, but didn’t expect fab costs to be so high, pulling the stock down overall (The Register headline: Intel's effort to build a foundry biz is costing far more – and taking longer – than expected).
I think most of the bad news for Intel is out of the way now. This idea is also a long-term idea (one year) and still has a lot of time to play out.
Long NKLA (Nikola)
I remain very bullish for Nikola.
This idea played out very nicely in the short-term, with the stock rising from $0.60 to almost $1.20 in the last week of March.
A broad market sell-off coupled with a large stock dilution proposal with little communication from the company sunk the stock afterwards. I don’t see a stock dilution plan as a significant problem. Authorized shares != issued shares and Nikola’s modus operandi has always been to secure enough funding for operations for the next year.
The company’s fundamentals, as it pertains to the build-out of hydrogen fueling infrastructure and sales of hydrogen and battery truck have never been better and the company continues to execute vigorously and successfully towards both.
With the recent large rise in oil prices, alternative fuel sources become more and more valuable. Geopolitical tensions near some of the world’s largest oil-producing regions are very high right now are very high right now and I won’t be surprised if oil continues to climb over the next few months.
Nikola’s achievements
IMC, the largest marine drayage firm in the US, expands its hydrogen trucks order from 10 trucks to 50.
Edmonton, Alberta hydrogen fueling station complete. This came shortly after the completion of the Ontario, California hydrogen fueling station.
Loblaw Companies, a major Canadian supermarket conglomerate, is rumored to be testing Nikola trucks.
Sold 40 hydrogen trucks in Q1, significantly outperforming analyst expectations of 30 trucks.


