Market Pulse: Let's Revisit Macro
In 7 minutes, let's review the state of macro to understand where the market is headed for the next few weeks.
In 7 minutes, let's review the state of macro to understand where the market is headed for the next few weeks.
Using macro to analyze market trends usually boils down to answering two questions:
What’s the current level of liquidity in the economy?
What upcoming events will change the current liquidity situation?
In this newsletter issue, we’ll try to answer both questions succinctly to not bore our readers to sleep and hopefully provide some actionable insights in the process.
💡 Liquidity, Here and Now
To evaluate current liquidity conditions, we can look at three things.
✅ Lyn Alden’s liquidity equation
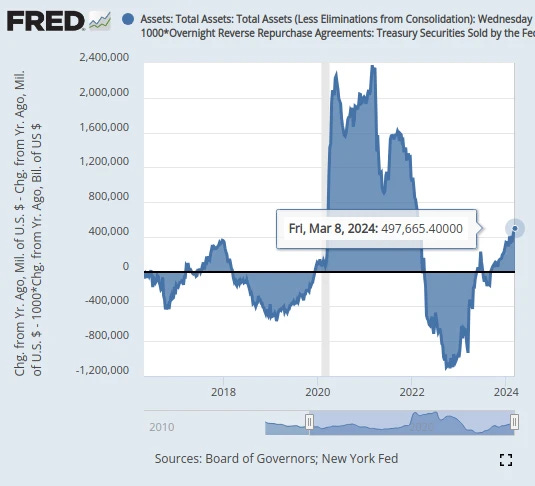
First, let’s revisit Lyn Alden’s liquidity equation that I shared in a previous newsletter issue. It’s a very rough but reasonable approximation of US liquidity using the principle that US liquidity in the current financial system is largely driven by three major financial institutions:
The balance at the Fed’s Overnight Reverse Repo (ON RRP) facility
The balance of the Treasury General Account
This is the bank account of the US Treasury. The more money that’s parked at the US Treasury, the less money for the economy
The Fed’s balance sheet
With Lyn’s equation, we see that flows in these big three liquidity institutions are net positive and rising.
This means that there’s likely still ample liquidity in the economy, which explains the continuation of the bull market in February.
✅ US treasury issuance
We know that the US Treasury needs to issue a massive amount of debt this year, around $10 trillion and double last year’s total debt issued.
In the first quarter alone, the Treasury needs to issue $700 billion of debt.
Money used to buy US treasuries is not available to buy stocks. As such to understand current liquidity conditions we need to understand how much US treasuries needs to be issued in the near term and whether the financial system can absorb the new treasuries.
We discuss below why there’s still significant liquidity available to support the large upcoming treasury issuances.
✅ Are bank reserves still ample?
As mentioned in previous issues, we are in an Ample Reserves Regime where the Fed has flooded banks with trillions of dollars of bank reserves (aka Quantitative Easing).
This high level of bank reserves serves as ballast against sudden unforeseen liquidity problems that could break the system.
However, we also know that the Fed is trying to cut back on the amount of bank reserves in the system by doing Quantitative Tightening and letting $60 billion of treasuries and $35 billion of mortgage-backed securities run off its balance sheet each month.
The risk of doing QT is that bank reserves could fall below “ample” levels. When that happens, the system is at a much greater risk of a liquidity shock.
The main question here is, how can we tell whether reserves are still ample or not?
A clear indicator that bank reserves may have fallen too low is when financial institutions begin using the Fed’s Standing Repo Facility (SRF).
The SRF allows financial institutions to obtain dollar liquidity by loaning their treasuries for bank reserves from the Fed.
As such, when the SRF starts getting used, you know that financial institutions are starting to be short on cash and we’re likely near the point of bank reserves falling below “ample” levels.
Here’s a fun fact: the 2019 September mini stock market crash was caused by this very type of liquidity crunch (the Fed was also conducting QT then) and it spurred the Fed to create the SRF.
On September 16th 2019, repo rates spiked from 2.43% to over 10% in one day (!) and the Fed was forced to step in to stabilize the repo markets with the creation of the SRF.
The Fed publishes daily SRF usage on the FRED data platform and usage continues to remain at zero since 2020. This is a good sign for liquidity.
💡 Liquidity in the Future
✅ Massive Vanna and Charm flows coming up
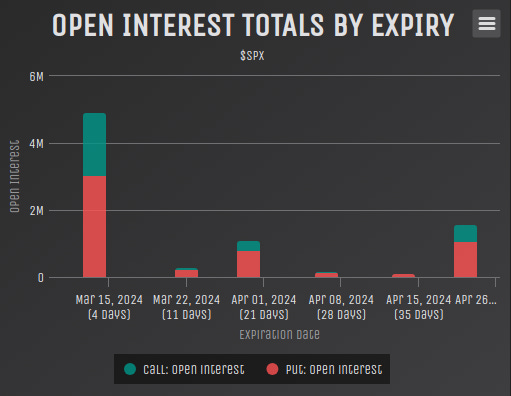
The March options expiry (OpEx) happens at the end of this week. Given that it’s a quarterly expiry and there was significant bearishness for February, this is a big expiry with a lot of bearish hedging.
As mentioned in previous newsletter issues, big options expiries without a prior corresponding market sell-off results in steadily increasing buying flows as we near the expiry date.
The general idea is that these options positions are usually bearish hedges and the lack of a market sell-off means that these options positions become more and more worthless as their expiry date draws near.
In simple terms, the gradual decay of value of these hedges results in the aforementioned buying flows as we approach the OpEx.
These flows are often referred to as Vanna and Charm flows.
For more on Vanna and Charm flows, we recommend reading this newsletter issue: How Expiring Options Move Markets.
With the March OpEx being so large, and the market so stable since the February OpEx, the Vanna and Charm flows this week will be significant.
This means that the market will likely steadily rise into the March OpEx on Friday.
✅ $400 billion available to buy new US treasuries
The balance at the Fed’s Overnight Reverse Repo (ON RRP) facility is a good measure of whether the market can handle the large upcoming treasury issuances from the US Treasury.
We went over why the ON RRP is relevant to supporting US treasury issuances in these newsletter issues: Market Pulse: The Federal Reserve's 2 Trillion Dollar Hole and Market Pulse: Liquidity is Surging.
The TLDR is that a big portion of the ON RRP balance comes from money market funds and they would redirect these funds to buy short-term US treasuries if the US Treasury chooses to issue short-term US treasuries.
The US Treasury had done exactly that in the past year, significantly increasing short-term treasury issuance so that money market funds can absorb the past year’s large treasury issuances with minimal impact on long-term interest rates.
This has caused the ON RRP balance to fall precipitously from $2 trillion a year ago to $400 billion today.
Although $400 billion is low compared to the ON RRP’s $2 trillion peak a year ago, it’s still $400 billion that’s readily available to buy new US treasury issuances.
As such, we don’t expect to see near-term market turbulence from treasury issuances.
❌ Energy costs are rising
Two weeks ago, Russia unexpectedly announced a 6-month long ban on gasoline exports starting on March 1st. Despite major Western sanctions on Russian energy, Russia remains a major international supplier of fossil fuels.
This ban should gradually exert upwards pressure on energy prices worldwide.
Given that energy prices are a top input to inflation, it wouldn’t be surprising for market anxiety to rise on fears of higher inflation during the summer.
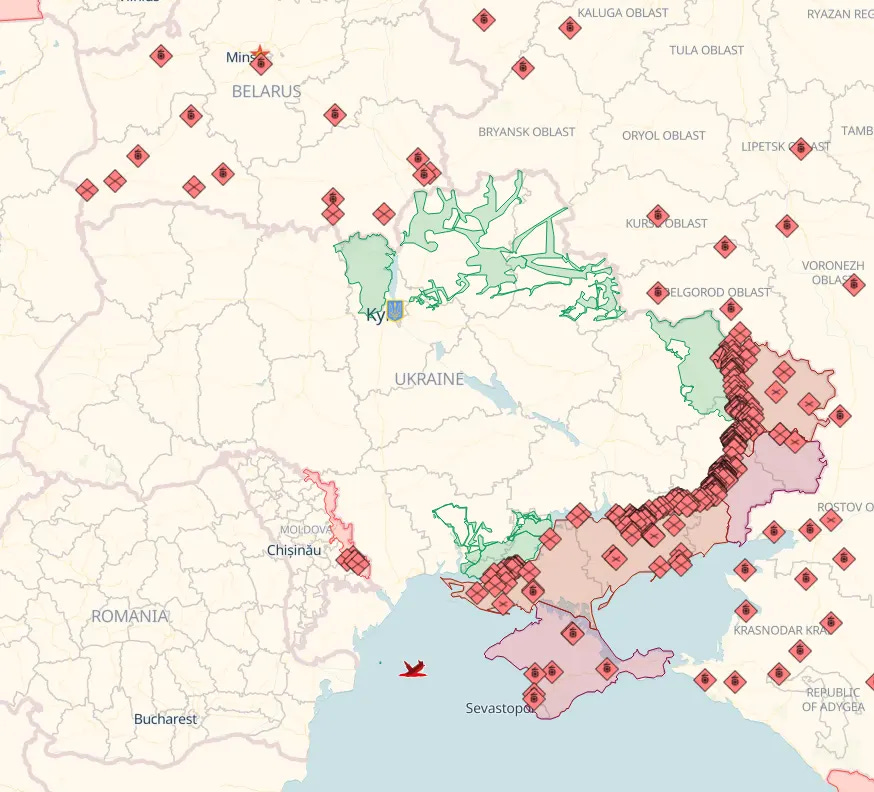
Tensions around global energy supply will only increase as the Eastern European conflict shifts heavily in Russia’s favor, as it looks like it’s starting to right now.
❌ The Fed’s emergency regional bank rescue facility ends on March 11th
Last year, to stave off a major regional banking crisis, the Fed created an emergency lending facility called the Bank Term Funding Program (BTFP).
The BTFP has been providing significant liquidity to banks to support the steep devaluation of long-term debt on their balance sheets that was caused by rapidly rising interest rates.
Well, the BTFP expires today and with it goes a major source of liquidity for banks. However, with interest rates stabilizing and possibly even falling, this might not be a big deal.
Regardless, the existence of the BTFP is always better for liquidity than its absence.
❌ VIX expiration and the Federal Reserve’s March FOMC meeting on March 20th
Two major events will happen after the March OpEx that could be problematic for markets.
First, the March VIX expiration (VIX futures options expiry) will happen on the following Wednesday. Monthly VIX expirations have recently been quite tumultuous for markets.
The recent VIX expirations have resulted in around a 2% S&P 500 sell-off that was subsequently bought up. This could be because these VIX expirations have occurred before monthly OpEx’s, allowing the sell-offs to be supported by the ongoing Vanna and Charm flows.
However, March’s VIX expiration will happen after the March OpEx and any selling this time from the VIX expiration will not have Vanna and Charm flows to support the market.
The second major market event to happen after the March OpEx is the Fed’s pivotal March FOMC meeting. As we all know, FOMC meetings have been particularly volatile for markets given how important Fed policy has become for markets ever since the pandemic.
Get this, the March FOMC meeting will happen on the same day as March’s VIX expiration.
Talk about a perfect storm.
As such, we expect to see significant volatility next week and there’s a high chance it could be the start of a multi-month market sell-off.
💡 In Conclusion
Putting everything together, we think that the market is in a very tenuous spot.
Although the March OpEx’s large Vanna and Charm flows will keep the market mostly green for this week, after the OpEx, the market will be left to the wolves.
The supportive Vanna and Charm flows will vanish just as the market is assaulted by two major high-risk events, the March VIX expiration and the March Fed FOMC meeting.
Combine this with Russia’s gasoline export ban and the end of the BTFP, the market has many reasons to sell off and this tenuous period could serve as the perfect excuse for the start of a period of significant market consolidation after the relentless bull market that began in November.


What are your thoughts on CPI and when the Fed will start cutting interest rates?
0dtes, risky or non-factor?